Presenting scientific work in a meaningful way
In light of my upcoming presentation at the University of Akron, as well as my poster presentation later this month at the Society for Neuroscience Annual Meeting, I want to bring light to two helpful sites to help presentation-averse engineers present their work in the most meaningful light.
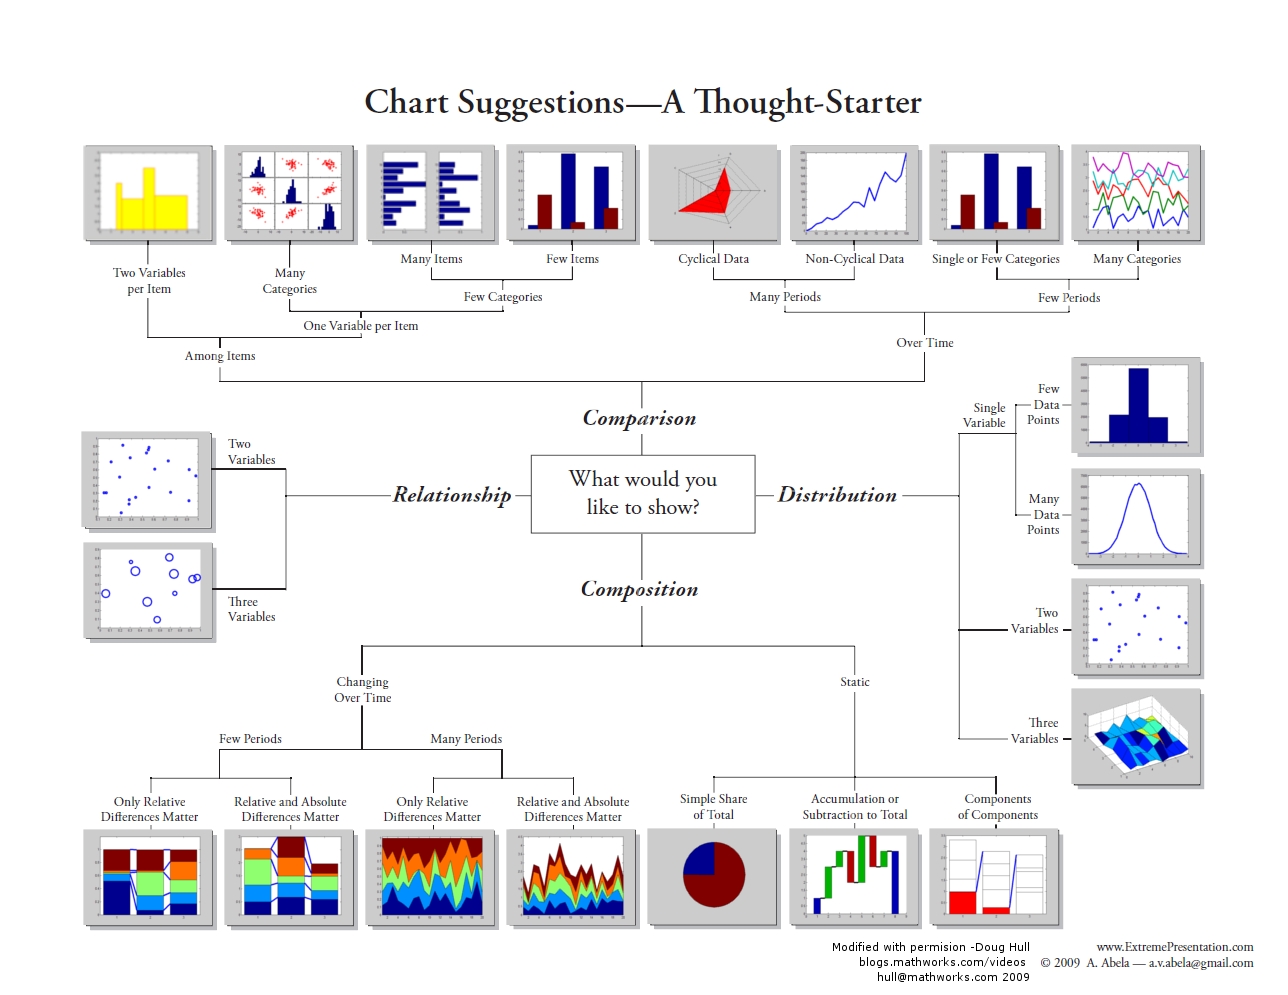
The first, from Dr. Andrew Abela, is a method for choosing the best form of visual representation for any particular set of data. Attending conferences & reading papers that include misleading bar charts or connecting data points that have no business being connected can lead to unfortunate conclusions from false visual presentation. I’ve introduced this decision chart in presentations to new graduate students repeatedly as I feel it’s a great starting point for data representation.
Additionally, I stumbled across Colin Purrington’s helpful & light-hearted analysis on what makes a good poster presentation. My training has made me partial to using less text and utilizing white-space more than he recommends, but it’s a great primer for those that don’t have a lot of experience attending conferences and want to make an impact.